
Overview
Few metropolitan areas better represent recent national demographic trends and the challenges of neighborhood- and school-based segregation than the Atlanta metro region. This article examines Atlanta's population shifts, suburbanization patterns, and school performance. Increasingly suburban, the region's African American population continues to face segregated housing patterns which undercut the ability to build wealth through homeownership, and largely segregated schools which hamper Black students' educational experiences and possibilities.

Atlanta metro region is known by many titles: as the "capital of the New South" thanks to a robust economy and rising population;1Obie Clayton, Cynthia Hewitt, and Gregory Hall, "Atlanta and 'The Dream': Race, Ethnicity, and Recent Demographic and Socioeconomic Trends," Past Trends and Future Prospects of the American City: The Dynamics of Atlanta, ed. David L. Sjoquist (Lanham: Lexington Books, 2009), 219–248. as "the capital city of black America" thanks to its substantial black middle class and its role as a key hub for black commercial activity, political leadership, and cultural production;2Richard Lloyd, "Urbanization and the Southern United States," Annual Review of Sociology 38 (2012): 483–506. and as a place of opportunity, good jobs, and a quality of life attractive to many people whose parents or grandparents left the region and the South decades ago.
The recent history of the Atlanta Metropolitan Statistical Area (MSA)3Officially the Atlanta-Sandy Springs-Roswell, GA Metropolitan Statistical Area, the "metro Atlanta" region includes the following twenty-eight counties: Barrow, Bartow, Butts, Carroll, Cherokee, Clayton, Cobb, Coweta, Dawson, DeKalb, Douglas, Fayette, Forsyth, Fulton, Gwinnett, Haralson, Heard, Henry, Jasper, Lamar, Meriwether, Newton, Paulding, Pickens, Pike, Rockdale, Spalding, and Walton. illustrates the shift of the US population to the South and West,4See Census Regions and Divisons of the United States for the states included in each Census region, http://www2.census.gov/geo/pdfs/maps-data/maps/reference/us_regdiv.pdf. As used throughout this essay, "region" refers to the Atlanta metropolitan region or Atlanta MSA. a trend that has accelerated since 1970.5Between 1970 and 2010, for example, as the Northeast's population grew by 13 percent and the Midwest's by 18 percent, the South's nearly doubled (increasing 82 percent) and the West's more than doubled (increasing 107 percent) (Table 16. Population: 1790 to 1990, retrieved from https://www.census.gov/population/www/censusdata/files/table-16.pdf; Table P1 Total Population from both the Census 2000 Summary File 1 (SF 1) 100-Percent Data and the 2010 Census Summary File 1, retrieved from American FactFinder, http://factfinder.census.gov). It especially shows the effects of what demographers are calling the New Great Migration, the movement of African Americans to the South from northern and midwestern cities.6The "New Great Migration" title stems from the fact that the pattern represents a reversal of what is known as the Great Migration, or the mass movement of African Americans out of the South primarily to northern, midwestern, and California cities, from roughly 1910 to 1970. Participants tend to have higher education and income levels than long-time southern residents, and the influx of these individuals and households into metro Atlanta has swelled the region's black middle class, which is now bigger than metro Chicago's and exceeded only by that of New York City and Washington, DC.
Localized trends complement national data. Nationally, there is the seventy-year shift from cities to suburbs. For whites, suburbanization occurred rapidly from the 1940s through the 1970s. Since the 1970s, the share of whites in suburbia has remained fairly constant (at roughly three-quarters of all whites). Whites are now exurbanizing—moving from higher density, inner-ring suburbs to emerging suburbs further from the urban core. For African Americans, the shift from city to suburb began in earnest in the 1970s (the Fair Housing Act, which outlawed discrimination in housing, became law in 1968). In the Atlanta metro region, by 2010, fully 87 percent of the African American population lived in the suburbs. The metro region now has more suburban African American homeowners than any other MSA in the country.


Despite Atlanta's reputation as a booming city, and although it has attracted hundreds of thousands of new residents—including many highly educated and high-income migrants—the metro region ranks behind nearly all other large MSAs in terms of providing its poorer residents with access to opportunities for upward mobility. And, despite the Atlanta African American population's achieving high levels of suburban residency and homeownership, residential segregation remains stubborn.7 John R. Logan and Brian Stults, The Persistence of Segregation in the Metropolis: New Findings from the 2010 Census (Washington DC: American Communities Project, Russell Sage Foundation, 2011), http://www.s4.brown.edu/us2010/Data/Report/report2.pdf. Census brief prepared for Project US2010.
This essay explores these quandaries using data from the US Census, the American Community Survey, and the Georgia Department of Education. Among the key findings is that, first, even as the metropolitan region's African American population becomes increasingly suburban, residents remain equally (if not more) likely to live in racially segregated neighborhoods. This analysis documents how stubborn residential segregation (partially the result of ongoing white flight from those areas attracting minority residents) has serious implications for black households' ability to build wealth through homeownership. The private real estate market tends to undervalue housing in more diverse neighborhoods, and the Great Recession and housing bust, which were particularly severe in metro Atlanta, have disproportionately harmed the region's minority communities.
Second, even as Atlanta's African American population becomes increasingly suburban, its African American public school students remain isolated in majority-minority schools. By 2013, African American students attending public schools within the Atlanta MSA were more likely to attend majority-minority schools (64 percent did so) than they had been in 2000 (58 percent). This is accompanied by disparities between majority-white and majority-minority schools in terms of both school quality and student achievement, which hampers black children's (particularly low-income black children's) access to upward mobility.8Raj Chetty, Nathaniel Hendren, Patrick Kline, and Emmanuel Saez, "The Equality of Opportunity Project," http://www.equality-of-opportunity.org/; John D. Barge, PK-12 Student Enrollment by Race/Ethnicity and Gender (Georgia Department of Education, Full Time Equivalent Data Collection System, 2000 and 2013). This is evidenced by the region's "especially low" upward mobility among children in low-income families, something "especially noteworthy" given the MSA's strong growth.9 Chetty, Hendren, Kline, and Saez, "The Equality of Opportunity Project."
Atlanta, "Superlative City"?
Population and demographic shifts in metro Atlanta represent broader national trends and offer extreme cases. Atlanta sits within a Census-defined, multi-state grouping ("region")10The Census-defined "South" includes Alabama, Arkansas, Delaware, District of Columbia, Florida, Georgia, Kentucky, Louisiana, Maryland, Mississippi, North Carolina, Oklahoma, South Carolina, Tennessee, Texas, Virginia and West Virginia. that has experienced rapid population growth over the last forty years; the Census South reached 114,555,744 residents in 2010—roughly double its 1970 population.11Table 16. Population: 1790 to 1990, retrieved from www.census.gov/population/www/censusdata/files/table-16.pdf; Table P1 Total Population from both the Census 2000 Summary File 1 (SF 1), 100-Percent Data and the 2010 Census Summary File 1, retrieved from factfinder.census.gov. Georgia, the fifteenth most populous state in 1970, now ranks as the ninth most populous.12"State of Metropolitan America," Brookings Institution, http://www.brookings.edu/about/programs/metro/stateofmetroamerica; US Department of Congress, Economics and Statistics Administration, Bureau of the Census, "1990 Census of Population and Housing Unit Counts" (1993), https://www.census.gov/prod/cen1990/cph2/cph-2-1-1.pdf. The Atlanta MSA has surpassed in size other population centers in the Northeast and Midwest: by 2010, metro Atlanta's population was the nation's ninth largest, exceeding that of metro Boston, metro Detroit, and metro San Francisco—all metro areas that had been larger than Atlanta as recently as 2000.13Frank Hobbs and Nicole Stoops, Census 2000 Special Reports: Demographic Trends of the 20th Century (Washington, DC: US Census Bureau, 2002), https://www.census.gov/prod/2002pubs/censr-4.pdf.
The migration of people to Atlanta from elsewhere within the United States has played a large part in the region's growth during the last decade. Between 2000 and 2010, the metro region's net domestic in-migration figure was 412,832—or roughly equivalent to the total population of the City of Atlanta in 2010 (420,003).14 William H. Frey, Diversity Spreads Out: Metropolitan Shifts in Hispanic, Asian, and Black Populations Since 2000 (Washington, DC: Brookings Institution, 2006), http://www.brookings.edu/research/reports/2006/03/demographics-frey. This wave of domestic migrants is part of what demographers are calling the New Great Migration,15Dan Bilefsky, "For New Life, Blacks in City Head to South," New York Times, June 22, 2011, A1, http://www.nytimes.com/2011/06/22/nyregion/many-black-new-yorkers-are-moving-to-the-south.html; William H. Frey, The New Great Migration: Black Americans' Return to the South, 1965–2000 (Washington, DC: Brookings Institution, 2004), http://www.brookings.edu/research/reports/2004/05/demographics-frey; Elspeth Reeve, "South Now More Integrated, More Racially Diverse," The Wire: News from the Atlantic, March 2011, http://www.thewire.com/national/2011/03/statistical-proof-south-finally-more-integrated/36096/. or the reversal (now several decades underway) of the Great Migration of southern blacks to northern, midwestern, and western cities.16The Great Migration refers to the movement of roughly six million African Americans out of the South between the years of the First World War to the 1970s. See Isabel Wilkerson, The Warmth of Other Suns: The Epic Story of America's Great Migration (New York: Random House, 2010), 8–9. Movers sought to escape the "oppressive racial climate in the South"—the segregation, discriminatory practices, and overt racism that typified the Jim Crow era. In addition to the "promise of freedom" outside the South was the wealth of opportunity in the industrial cities of the Northeast and Midwest. The millions of manufacturing jobs available to unskilled workers in these locations stood in stark contrast to the quickly evaporating pool of agricultural jobs in the rural South, which were disappearing due to the "mechanization of southern agriculture," which entirely recast what had been a very labor-intensive system. See Frey, The New Great Migration, 2; Bilefsky, "For New Life, Blacks in City Head South"; Hope Yen, "In a Reversal, More Blacks Moving Back to South: Culture, Good Jobs, Relatives Spur Return," Washington Times, February 16, 2011, http://www.washingtontimes.com/news/2011/feb/16/in-a-reversal-more-blacks-moving-back-to-south/; Thomas J. Sugrue,The Origins of the Urban Crisis: Race and Inequality in Postwar Detroit, (Princeton, NJ: Princeton University Press, 1996), 7. Since the 1970s, the portion of African Americans living in the Northeast and Midwest has fallen—a trend that has only accelerated since 1990—and the portion of American blacks currently living in the Census-designated South (57 percent) is at its highest level since 1960.17William H. Frey, "The 2010 Census: How Is America Changing?" Urban Land (2011), http://www.frey-demographer.org/briefs/B-2010-3_ULJF11_p34_36.pdf; Hobbs and Stoops, Demographic Trends of the 20th Century; Sabrina Tavernise and Robert Gebeloff, "Many U.S. Blacks Moving to South, Reversing Trend," New York Times, March 25, 2011, A1, http://www.nytimes.com/2011/03/25/us/25south.html; Yen, "In a Reversal, More Blacks Moving Back to South." There are now ten times as many black Southerners who were born in the Northeast than there were in 1970—over one million in all.18Tavernise and Gebeloff, "Many U.S. Blacks Moving to South, Reversing Trend."
The New Great Migration was prompted in part by the conditions that those migrating out of the South encountered in these cities in the 1940s, 1950s, and 1960s. Far from tolerant and open, these cities practiced their own forms of racism and racial segregation, housing newcomers in severely overcrowded and increasingly distressed neighborhoods. As these cities lost manufacturing jobs to deindustrialization, they increasingly fell short of migrants' and residents' expectations.19Sugrue, The Origins of the Urban Crisis; Rebecca Leung, "Going Home To The South," CBS News, June 12, 2003, http://www.cbsnews.com/8301-18560_162-558375.html.
Importantly for Atlanta's story, the New Great Migration represents what African Americans now envision: "Better jobs and quality of life in the South are beckoning, as is the lure of something more intangible—a sense of home."20Yen, "In a Reversal, More Blacks Moving Back to South." Participants in the New Great Migration see "less of a struggle to survive in the South"21Bilefsky, "For New Life, Blacks in City Head to South." and more opportunities for making better lives for themselves and their children.22Ibid; Leung, "Going Home To The South"; Tavernise and Gebeloff, "Many U.S. Blacks Moving to South, Reversing Trend."

Especially for African Americans, the new pull (as opposed to push) of the South and push (as opposed to pull) of the Northeast and Midwest have transformed parts of the South—particularly places in Georgia, Florida, North Carolina, and Texas—into magnets.23Frey, The New Great Migration. In Georgia, for example, the African American population has nearly tripled since 1970 after remaining almost unchanged between 1940 and 1970; the state's black population grew by nearly 601,000 residents between 2000 and 2010.24Chris Kromm, "Black Belt Power: African Americans Come Back South, Change Political Landscape," Race, Poverty & the Environment 18, no. 2 (2011): 17, http://www.southernstudies.org/2011/09/black-power-african-americans-come-back-south-shake-up-southern-politics.html.
Approximately 80 percent of Georgia's African American population growth is highly concentrated in the Atlanta metro region. African Americans from across the United States are drawn by the region's substantial black middle class as well as its diversified and growing economy.25William H. Frey, Diversity Spreads Out: Metropolitan Shifts in Hispanic, Asian, and Black Populations Since 2000 (Washington, DC: Brookings Institution, 2006), http://www.brookings.edu/research/reports/2006/03/demographics-frey. The Atlanta metro actually gained more African American residents since 1990 than any other metropolitan area in the US, and the Atlanta MSA's black population growth accounted for roughly one-fifth of all black population growth occurring in the nation's one-hundred largest metropolitan areas since 2000.26Frey, "The 2010 Census"; Brookings Institution, "State of Metropolitan America." By 2010, African Americans accounted for 32.4 percent of all Atlanta MSA residents, up from 28.7 percent in 2000—the third largest among metropolitan areas nationwide.27Steven G. Wilson, David A. Plane, Paul J. Mackun, Thomas R. Fischetti, and Justyna Goworowska. Patterns of Metropolitan and Micropolitan Population Change: 2000 to 2010 (2010 Census Special Reports), SUS Census Bureau, C2010SR-01 (Washington, DC: US Department of Commerce, Economics and Statistics Administration, and US Census Bureau, 2012), http://www.census.gov/library/publications/2012/dec/c2010sr-01.html.
Long hailed as a "mecca of the black middle class,"28Marshall Ingwerson, "Atlanta Becomes Mecca for Black Middle Class in America," The Christian Science Monitor, May 29, 1987, http://www.csmonitor.com/1987/0529/amecca.html; David L. Sjoquist, "The Atlanta Paradox: Introduction," in The Atlanta Paradox, ed. David L. Sjoquist (New York City: Russell Sage Foundation, 2000), 1–14. Atlanta featured a "wealthy and educated black aristocracy" that grew up around the city's elite black colleges of Morehouse and Spelman. The city's ranking as one of the five best US cities for blacks in business helped support and expand its black business and professional class.29Ingwerson, "Atlanta Becomes Mecca for Black Middle Class in America." Today, the Atlanta MSA has the third-highest total of black households with incomes above $100,000 (behind only New York and DC metro regions and ahead of metro Chicago). By 2011, 83,349 high-income black households lived in metro Atlanta, a 51,085-household increase since just 2000.30American Community Survey, Table B19001B, "Household Income in the Past 12 Months," 2007–2011 American Community Survey 5-Year Estimates, https://www.census.gov/newsroom/releases/archives/news_conferences/20121203_acs5yr.html. The Atlanta region is now second only to the New York City MSA in terms of its number of black homeowners. Between 2000 and 2011, metro Atlanta's black homeowners nearly tripled (from 110,872 to 317,411), surpassing totals for Chicago, Washington, and Philadelphia.31American Community Survey, Table P151B, "Household Income in 1999," Census 2000 Summary File 3 (SF 3).
Metro Atlanta not only houses one of the nation's largest concentrations of the black middle class, but it does so principally in its suburbs. This geographic dispersal from the urban core is not unique to Atlanta: between 1990 and 2010, the percentage of African Americans living in the suburbs of the country's one-hundred largest metropolitan areas jumped from 37 percent to 51 percent. For the first time, more blacks in these metros lived in suburbs than cities.32 William H. Frey, Melting Pot Cities and Suburbs: Racial and Ethnic Change in Metro America in the 2000s (Washington, DC: Brookings Institution, 2011), http://www.brookings.edu/research/papers/2011/05/04-census-ethnicity-frey. The Atlanta MSA, however, was not only ahead of this trend (47 percent of the metro's black residents were living in suburban areas in 1980), but also represents an extreme case (by 2010, Atlanta's suburbs housed fully 87 percent of the metro's African American population).33This analysis relied on the Brookings Institution's labeling of tracts as either urban or suburban, which considers urban census tracts to be those within either the primary city listed in the official MSA name or in other cities listed in the MSA names that have populations of at least 100,000. Suburban census tracts are those whose center point falls within the MSA boundary but outside the MSA's city or cities. In the Atlanta MSA, only tracts within the city of Atlanta are considered urban; all tracts outside of the city in DeKalb and Fulton Counties, as well as all tracts in Barrow, Bartow, Butts, Carroll, Cherokee, Clayton, Cobb, Coweta, Dawson, Douglas, Fayette, Forsyth, Gwinnett, Haralson, Heard, Henry, Jasper, Lamar, Meriwether, Newton, Paulding, Pickens, Pike, Rockdale, Spalding, and Walton Counties, are considered suburban. Between 2000 and 2010, the Atlanta MSA gained more suburban black residents than any other MSA.34John Sullivan, "African Americans Moving South—and to the Suburbs," Race, Poverty & the Environment 18, no. 2 (2011): 16–19, http://reimaginerpe.org/18-2/sullivan. The region's roughly half-a-million new suburban black residents number more than two-and-a-half times that for Washington and more than four times that of Chicago.35Frey, Melting Pot Cities and Suburbs.

Eleven of the Atlanta region's twenty-eight counties36These eleven include the suburban portions of DeKalb and Fulton counties, which also include sections of the city of Atlanta. accounted for nearly all (98 percent) of the metro area's increase in African American residents between 2000 and 2010; by 2010, these counties housed 79 percent of the metro's black population. For analytical purposes, these counties fall into three groups: 1) "historically black" suburban counties, or those that have long been majority-black (Clayton and DeKalb counties, and southern Fulton County); 2) "nearing majority black" suburban counties, or those in which African Americans now comprise approximately one-fourth to one-half of all residents yet which were all only roughly one-fifth African American as recently as 2000 (Cobb, Douglas, Newton, and Rockdale counties)37 At the time of publication, Cobb was included with other counties listed as "nearing majority black" because it was statistically more like those counties than those classified as "diversifying." However, at 24% black, Cobb County was on the border and could have been included as either "nearing majority black" or "diversifying." and 3) "diversifying" suburban counties, or those that were nearly entirely white in 2000 but that now have a substantial minority of African American residents (Fayette, Gwinnett, Henry, and Paulding County, and northern Fulton County). The remaining suburban counties in the Atlanta region collectively added fewer than forty-thousand African American residents (in contrast to over 200,000 white residents).

Although home to over half of the metro's African American population in 2000, Atlanta's "historically black" suburban core accounted for less than one-fourth of the growth in metro black population between 2000 and 2010. Suburban DeKalb County's non-Hispanic black population, for example, grew by just 6 percent (or by less than 20,000). In a "dramatic reversal of the longstanding pattern," not only did black population growth into historically black suburbs slow, the City of Atlanta's non-Hispanic black population actually declined by more than 30,000 between 2000 and 2010.38Eric Freeman, "The Shifting Geography of Urban Education," Education and Urban Society 42, no. 6 (2010): 674–704.
Far more of the growth in the metro's African American population occurred outside of this core—in historically less diverse suburbs. Nationally, blacks are increasingly moving to places like these: between 2000 and 2010, 2 percent of all black population growth "occurred in counties that have traditionally been black population centers," while 20 percent "occurred in counties where only a tiny fraction of the population had been black."39Tavernise and Gebeloff, "Many U.S. Blacks Moving to South, Reversing Trend." In the Atlanta metro, roughly one-third (30 percent) of all black population gains between 2000 and 2010 occurred in four suburban counties that were all approximately 20 percent African American at the beginning of the decade (the "nearing majority black" suburban counties), and nearly half (45 precent) of all black population gains occurred in five counties that were all less than 15 percent African American in 2000 (the "diversifying" suburban counties).
Cobb, Douglas, Newton, and Rockdale counties comprise the former group, the "nearing majority black" suburban counties. Across these four counties, the number of African American residents nearly doubled between 2000 and 2010 (156,262 to 298,807). In Douglas, Newton, and Rockdale Counties, the African American population tripled during this time period, and in each of these counties non-Hispanic blacks now account for roughly two-in-five residents (up from just one-in-five ten years prior).
| Geography | Non-Hispanic Black Population | % Non-Hispanic Black | Change in Non-Hispanic Black Residents (2000-2010) | % of MSA's Black Population Growth | ||
|---|---|---|---|---|---|---|
| 2000 | 2010 | 2000 | 2010 | |||
| Clayton County | 120,816 | 169,020 | 51% | 65% | 48,204 | 10% |
| DeKalb County (Outside Atlanta) | 340,238 | 360,016 | 54% | 54% | 19,778 | 4% |
| Fulton County (South) | 104,575 | 144,933 | 74% | 80% | 40,358 | 9% |
| Historically Black Subtotal | 565,629 | 673,969 | 56% | 61% | 108,340 | 23% |
| Cobb County | 112,924 | 168,053 | 19% | 24% | 55,129 | 12% |
| Douglas County | 16,978 | 51,387 | 18% | 39% | 34,409 | 7% |
| Newton County | 13,690 | 40,371 | 22% | 40% | 26,681 | 6% |
| Rockdale County | 12,670 | 38,996 | 18% | 46% | 26,326 | 6% |
| Nearing Majority Black Subtotal | 156,262 | 298,807 | 19% | 30% | 142,545 | 30% |
| Fayette County | 10,383 | 21,117 | 11% | 20% | 10,734 | 2% |
| Fulton County (North) | 23,817 | 44,039 | 8% | 13% | 20,222 | 4% |
| Gwinnett County | 76,837 | 184,122 | 13% | 23% | 107,285 | 23% |
| Henry County | 17,435 | 74,056 | 15% | 36% | 56,621 | 12% |
| Paulding County | 5,634 | 23,810 | 7% | 17% | 18,176 | 4% |
| Diversifying Subtotal | 134,106 | 347,144 | 11% | 22% | 213,038 | 45% |
| Combined | 855,997 | 1,319,920 | 68% | 75% | 463,923 | 98% |
| Atlanta | 250,769 | 222,432 | 61% | 53% | -28,337 | -6% |
| Remainder of MSA | 99,720 | 137,627 | 4% | 4% | 37,907 | 8% |
| MSA Total | 1,206,486 | 1,679,979 | 28% | 32% | 473,493 | |
"Diversifying" counties—those with nominal black populations in 2000 but where African Americans accounted for a significantly larger share of all residents by 2010—added nearly as many African Americans (213,038) as "historically black" and "nearing majority black" suburban counties combined (250,885). The numbers of African American residents in "diversifying" Fayette, northern Fulton, and Gwinnett counties each approximately doubled over the course of the decade; the numbers in Henry and Paulding counties more than quintupled.
By 2010 nearly half (47 percent) of metro Atlanta's non-Hispanic black population lived outside of the City of Atlanta and also outside those historically black suburban counties adjacent to the city. "Nearing majority black" counties' share of all non-Hispanic black residents increased from 13 percent to 18 percent. "Diversifying" counties' share jumped from 11 percent to 21 percent—ahead of "nearing majority black" suburban counties and far beyond the current share of the City of Atlanta (13 percent by 2010).

Despite blacks' substantial inroads into suburban areas further from the central city, trends among non-Hispanic white households muted the impact of this suburbanization on region-wide segregation levels. Significant "racial differences in the . . . desirability [of] particular neighborhoods" resulted in considerable differences between the migration patterns of metro Atlanta's black and white households.40Casey J. Dawkins, "Recent Evidence on the Continuing Causes of Black-White Residential Segregation,"Journal of Urban Affairs 26, no. 3 (2004): 379–400. In the Atlanta MSA, nearly all of the counties adding non-Hispanic black households between 2000 and 2010 lost non-Hispanic whites. While the number of non-Hispanic whites increased within the City of Atlanta (which lost over 30,000 non-Hispanic blacks), nearly all of the other counties gaining more than 10,000 non-Hispanic white residents were on the edges of the metro region. Besides "diversifying" Henry and Paulding counties (which added 11,533 and 33,551 non-Hispanic whites between 2000 and 2010) all other counties experiencing substantial increases in non-Hispanic whites were among those suburban counties that gained only nominal numbers of non-Hispanic blacks.41Barrow, Bartow, Carroll, Cherokee, Coweta, Forsyth, and Walton counties collectively gained over 175,000 non-Hispanic white residents between 2000 and 2010; over the same time period, the number of non-Hispanic blacks in these counties rose by less than 35,000.
 |  |
As a result, although metro Atlanta's blacks "are less geographically concentrated, less confined to areas near the urban core, and scattered more widely around the metropolitan area," they remain highly segregated.42Douglas S. Massey and Nancy A. Denton, American Apartheid: Segregation and the Making of the Underclass (Cambridge: Harvard University Press, 1993). The persistence of the Atlanta MSA's high Index of Dissimilarity between whites and blacks illustrates ongoing segregation even amid changes in geographic concentration.43The Index of Dissimilarity, a popular summary statistic for quantifying an area's level of segregation, measures how evenly the populations of two racial or ethnic groups are distributed across a particular geographic area and describes the percentage of group members who would have to move in order for their racial or ethnic group to be evenly distributed (so that each Census tract's racial breakdown would match the MSA's overall racial breakdown). In 1990, metro Atlanta's Index of Dissimilarity for white and black residents was 66.3.44A value of 60 or more is considered high. It declined only slightly over the course of the 1990s—reaching 63.9 in 2000—and again over the next decade, remaining at 58.3 in 2010.45 Logan and Stults, The Persistence of Segregation in the Metropolis.


According to an analysis of Census tract-level data from the last three decennial censuses, over the course of the 1990s, the number of "majority black" and "segregated black" tracts in the Atlanta MSA increased slightly, as did the number of metro blacks living in them.46This study considers Census tracts with at least 20 percent non-Hispanic white residents and at least 20 percent non-Hispanic black residents to be "integrated." See Sheryll Cashin, The Failures Of Integration: How Race and Class are Undermining the American Dream (New York City: Public Affairs, 2004), 42. Census tracts in which more than 85 percent were of one race or ethnicity were classified as "segregated." See Ovetta Wiggins, Carol Morello, and Dan Keating, "Prince George's County: Growing, and Growing More Segregated, Census Shows," Washington Post, October 30, 2011, http://www.washingtonpost.com/local/prince-georges-county-growing-and-growing-more-segregated-census-shows/2011/10/14/gIQAbCc1TM_story.html. If tracts did not qualify "integrated" or "segregated," they were labeled "majority white," "majority black," or "majority Hispanic," if percentages of a particular race or ethnicity exceeded 50 percent. In 2010, 10 tracts had less than 15 percent white but no majority of either blacks or Hispanics (these were classified as "majority black/Hispanic"), and 12 tracts had more 15 percent white but no majority of any race or ethnicity (these were classified as "integrated"). By 2000, fully 50 percent of the region's African American population lived in either majority black or segregated black Census tracts (up from 48 percent in 1990). This held fairly steady between 2000 and 2010: the number of blacks living in segregated black Census tracts increased by 4,511 over the decade; by 2010, nearly half (47 percent) of the Atlanta MSA's African American population still lived in majority-minority or segregated-minority tracts.47"Majority-minority" tracts include "majority black," "majority "Hispanic," and "majority black/Hispanic" tracts; "Segregated-minority" tracts include "segregated black" and "segregated Hispanic" tracts.
The persistence of segregated housing patterns despite the ongoing suburbanization of the metropolitan region's black residents is deeply troubling. It brings serious consequences for black neighborhoods and homeowners. Whites have "much stronger" preferences for living in majority-white neighborhoods.48Dawkins, "Recent Evidence on the Continuing Causes of Black-White Residential Segregation"; Genevieve Siegel-Hawley, "City Lines, County Lines, Color Lines: The Relationship between School and Housing Segregation in Four Southern Metro Areas," Teachers College Record 115, no. 6 (2013): 1–45. http://www.tcrecord.org/Content.asp?ContentID=16988. Non-Hispanic whites are less likely to stay in their neighborhoods as the percentage of African Americans in those places rises, particularly as it reaches roughly one-third of all residents.49Massey and Denton, American Apartheid. As a result, the demand for housing among non-Hispanic whites decreases as neighborhood diversity increases, ultimately creating "racial differences in housing prices" and decreasing property values in diverse neighborhoods.50Dawkins, "Recent Evidence on the Continuing Causes of Black-White Residential Segregation."
David Rusk defines this housing value "drag"—or the difference between where property values would be if race were not a factor in housing choices, and where values are since race is a factor—as the "segregation tax" that minority households, particularly blacks, are forced to bear.51David Rusk, The "Segregation Tax": The Cost of Racial Segregation to Black Homeowners (Washington, DC: Brookings Institution, 2001), http://www.brookings.edu/research/reports/2001/10/metropolitanpolicy-rusk. Rusk finds a "segregation tax" for black homeowners and non-black homeowners living in majority-black neighborhoods in the nation's one-hundred largest MSAs. The "segregation tax" rises as metropolitan segregation levels increase.52Ibid.
Throughout the Atlanta region, the median house value is typically lower in more diverse Census tracts. For example, within the City of Atlanta, the typical median value in "majority white" or "segregated white" Census tracts was roughly three to five times the typical median in "majority black" or "segregated black" tracts; in the suburbs, the typical median value in "majority white" or "segregated white" Census tracts was double that in "majority black" or "segregated black" tracts.
| Tract Integration Level | Median Home Value (2011) | |
|---|---|---|
| City of Atlanta | All Suburban | |
| Segregated White | $648,570 | $250,038 |
| Majority White | $360,740 | $246,491 |
| Integrated | $253,113 | $176,370 |
| Majority Black | $128,311 | $126,195 |
| Segregated Black | $130,818 | $138,242 |
Another way to quantify this housing value drag in the Atlanta MSA is to replicate Rusk's "segregation tax" methodology: to calculate the difference between the median value to median owner income ratios for majority-non-Hispanic white and majority-non-Hispanic black neighborhoods. On average, homeowners in "segregated white" Census tracts in the city get $1.34 more in house value for every dollar of income than homeowners in "segregated black" tracts ($4.17 versus $2.83); homeowners in "segregated white" Census tracts in the suburbs get $0.55 more in house value for every dollar of income than homeowners in "segregated black" tracts ($2.91 versus $2.36).
| Tract Integration Level | Median Value-to-Median | |
|---|---|---|
| City of Atlanta | All Suburban | |
| Segregated White | $4.17 | $2.91 |
| Majority White | $3.30 | $2.75 |
| Integrated | $3.00 | $2.55 |
| Majority Black | $3.37 | $2.30 |
| Segregated Black | $2.83 | $2.36 |
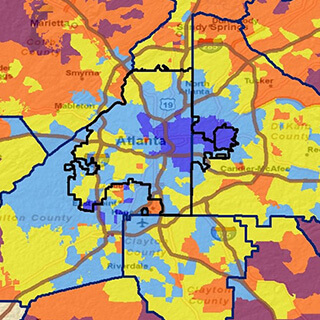
Mapping median values and median value to median owner income ratios for all Census tracts in the metropolitan area further illustrates the disparities between the more diverse inner ring suburbs (particularly those south and west of the city) and the less diverse suburban fringe (particularly the area to the far north and east of the city).
 |  |
"Historically black" southern Fulton County and "diversifying" Cobb and Gwinnett counties are good illustrations of the "segregation tax" at work. While Census tracts throughout all three counties tend to have higher median values (and are shaded yellow and green on the map above), values tend to be lower relative to incomes (resulting in the three counties appearing almost universally orange on the map above), particularly in contrast to less diverse Cherokee, Fayette, and Forsyth counties.
Lower values in diverse neighborhoods can enable more modest-income households to become homeowners and can be used as "an economic development selling point."53Ibid. Conversely, however, deflated values make homes in diverse neighborhoods "poor long-term investments" and reduce owners' ability "to build equity through homeownership" or leverage their home to borrow for other household expenses, like retirement or college tuition.54Ibid.
Residential segregation also has a tendency to concentrate the negative effects of discriminatory lending practices and differential access, based on race, to home purchase and home improvement financing. This became abundantly clear as the Great Recession unfolded and the housing bubble burst. Both were "particularly bad … for the country … and especially so for African Americans," severely, and disproportionately, affecting minority households and neighborhoods.55Algernon Austin, Reversal of Fortune: Economic Gains of 1990s Overturned for African Americans from 2000–07 (Washington, DC: Economic Policy Institute, 2008), http://www.epi.org/publication/bp220/.
This discrepancy stemmed from the fact that, during the housing boom, African Americans nationally were far more likely than whites to rely on subprime (as opposed to prime) mortgage loans.56Ibid; Rakesh Kochhar, Ana Gonzalez-Barrera, and Daniel Dockterman, Through Boom and Bust: Minorities, Immigrants and Homeownership (Washington, DC: Pew Hispanic Center, 2009), http://www.pewhispanic.org/files/reports/109.pdf. In 2006 and 2007, during the height of the boom, black borrowers were three times as likely as white borrowers to take out higher priced57Higher-priced loans are defined as those with annual percentage rates that exceed the rate of US Treasury securities of comparable maturity by 3 percentage points. The chart reflects trends among conventional, first-lien loans borrowed for the purchase of 1- to 4-family properties for owner occupancy. subprime loans (33.5 percent for blacks versus 10.5 percent for whites in 2006, 52.8 percent for blacks versus 17.5 percent for whites in 2007).58Austin, Reversal of Fortune; Kochhar, Gonzalez-Barrera, and Dockterman, Through Boom and Bust. This "racial gap in subprime lending" held across income levels, even increasing among higher-income households.59Jacob S. Rugh and Douglas S. Massey, "Racial Segregation and the American Foreclosure Crisis." American Sociological Review 75, no. 5 (2010): 629–651.
Nationally, too, borrowers with subprime loans were far more likely than borrowers with prime loans to face foreclosure; between 2005 and 2009, the foreclosure rate on subprime loans skyrocketed from 3.3 percent to 15.6 percent.60Ibid. The result: black borrowers were nearly twice as likely as white borrowers to experience foreclosure (7.9 percent versus 4.5 percent of non-Hispanic whites).61Debbie Gruenstein Bocian, Wei Li, and Keith S. Ernst, Foreclosures by Race and Ethnicity: The Demographics of a Crisis (Durham, NC: Center for Responsible Lending, 2010), http://www.responsiblelending.org/research-publication/foreclosures-race-and-ethnicity. Foreclosures hit black households so hard that the overall homeownership rate among African Americans fell from 49.4 percent in 2004 to 47.5 percent in 2008, a drop steeper than that among white households and one that wiped out four years of black homeownership gains.62Kochhar, Gonzalez-Barrera, and Dockterman, Through Boom and Bust.
Residential segregation concentrates the risks associated with subprime loans (and other predatory practices more likely encountered in minority households, such as loan flipping and equity stripping schemes) in minority neighborhoods.63Jacob S. Rugh and Douglas S. Massey, "Racial Segregation and the American Foreclosure Crisis," American Sociological Review 75, no. 5 (2010): 629–651. A study by the Department of Housing and Urban Development in the late 1990s found that high-cost subprime lending was far more common in predominantly black neighborhoods than predominantly white ones. In metro Atlanta at that time, nearly all of the Census tracts in which subprime loans accounted for at least 25 percent of refinance mortgages were at least 30 percent black.64US Department of Housing and Urban Development, Unequal Burden: Income & Racial Disparities in Subprime Lending in America, (Washington, DC: US Department of Housing and Urban Development, 2000), http://www.huduser.org/portal/publications/fairhsg/unequal.html. These disparities also existed during the housing boom of the 2000s. According to Neighborhood Stabilization Program Data reflecting high cost loans from 2004 to 2006, Atlanta MSA Census tracts with larger minority populations had larger percentages of high-cost loans than predominantly white ones—and this held for both city tracts and suburban tracts, even after controlling for owner incomes.
As the housing boom became the housing bust, the prevalence of these subprime loans made metro Atlanta one of the "distinct epicenters" of the foreclosure crisis.65Kochhar, Gonzalez-Barrera, and Dockterman, Through Boom and Bust. Of the 3,141 counties nationwide, just 270 (or 9 percent of all counties) had foreclosure rates of 1.8 percent or higher in 2008. Twenty-three of these high-foreclosure counties were in Georgia; the vast majority of these (19 of the 23) were in the Atlanta MSA.66Ibid.

These nineteen Atlanta MSA counties included all of the metro's historically black counties and also all of the "nearing majority black" and "diversifying" suburban counties. Henry County—a "diversifying" suburban county—was among just thirty-three counties in the United States to have a foreclosure rate of more than 5 percent in 2008.67Ibid.
Below the county level, Neighborhood Stabilization Program Data shows that foreclosure rates during the height of the crisis (2007 and 2008) were far higher in diverse Census tracts than predominantly white tracts, even after controlling for owner incomes.
The "economic fallout [of the housing bust] was unevenly spread over the urban landscape," and not just minority households but minority neighborhoods "bore the brunt of the foreclosures."68Rugh and Massey, "Racial Segregation and the American Foreclosure Crisis." Property values declined, hurting local homeowners whether they had been subprime borrowers or not and exacerbating disparities in values between predominantly white and predominantly minority areas.69Austin, Reversal of Fortune. This, in turn, has had serious consequences for neighborhood conditions and quality of life, on the caliber of local amenities and public services, especially public schools.
Segregation and Schools

Beyond adversely affecting the health and stability of neighborhood housing markets, residential segregation has had a profound effect on students' experiences in public schools. Just as the Atlanta region's increasing suburbanization of minority group members has not translated into the greater integration of its neighborhoods, so too has it not translated into the greater integration of its schools.70Richard Fry, The Rapid Growth and Changing Complexion of Suburban Public Schools (Washington, DC: Pew Hispanic Center, 2009), http://www.pewhispanic.org/files/reports/105.pdf. The metro region's in-school trends mirror trends found nationally: suburban areas with increasing shares of minority students have "experienced, on average, increasing segregation levels between white and minority students" (emphasis added).71Sean F. Reardon, John T. Yun, and Tamela McNulty Eitle, "The Changing Structure of School Segregation: Measurement and Evidence of Multiracial Metropolitan-Area School Segregation, 1989–1995," Demography 37, no. 3 (2000): 351–364. As suburban school districts become more diverse, many experience "white flight," prompted by "the 'push' of interracial contact and the 'pull' of nearby whiter school districts."72Charles T. Clotfelter, Are Whites Still "Fleeing"? Racial Patterns and Enrollment Shifts in Urban Public Schools, 1987–1996, Working Paper 7290 (Cambridge: National Bureau of Economic Research, 1999), http://www.nber.org/papers/w7290; Freeman, "The Shifting Geography of Urban Education." This concentrates minority households and students in particular neighborhoods and school districts or schools.73Reardon, Yun, and Eitle, "The Changing Structure of School Segregation."
In metro Atlanta, white enrollment decreased between 2000 and 2013 in school districts in "nearing majority black" and "diversifying" suburban counties—those counties where black enrollment numbers grew substantially.
A particularly dramatic transformation occurred in six suburban districts in the Atlanta MSA, all of which went from roughly one-third minority in 2000 to two-thirds minority by 2013.
Even as the percentage of African American students attending suburban schools increased from 80 percent in 2000 to 89 percent by 2013, the portion attending majority-minority74Majority-minority here refers to any school in which at least half of all students are not non-Hispanic white. For consistency sake, "integrated" schools are identified using the same criteria as those used to identify "integrated" Census tracts earlier in this essay. schools increased more than twice as fast, from 49 percent to 61 percent. In "diversifying" suburban counties, while the portion of black students attending "integrated" schools did increase slightly (from 46 percent to 50 percent), the percentage in majority white schools plummeted (from 51 percent to just 12 percent) and the percentage in majority-minority schools skyrocketed (from 3 percent to 37 percent).
| School District | County Type | % Minority | % Black | ||
|---|---|---|---|---|---|
| 2000 | 2013 | 2000 | 2013 | ||
| Cobb County | Nearing Majority Black | 33% | 57% | 22% | 31% |
| Douglas County | Nearing Majority Black | 26% | 68% | 21% | 50% |
| Gwinnett County | Diversifying | 33% | 71% | 15% | 31% |
| Henry County | Diversifying | 22% | 62% | 17% | 47% |
| Newton County | Nearing Majority Black | 34% | 63% | 30% | 52% |
| Rockdale County | Nearing Majority Black | 29% | 79% | 22% | 61% |
In "nearing majority black" suburban counties, just 12 percent of black students attended a majority-minority school in 2000; by 2013, over half (52 percent) did so. Over the decade, the portion of students in "integrated" schools in these counties also declined substantially: from 69 percent in 2000 to just 48 percent by 2013.


At the same time, districts in historically black areas of the metro region (especially the City of Atlanta, DeKalb County, and Fulton County) remained highly segregated. In the 2006–2007 school year, DeKalb had the third-highest dissimilarity index among the nation's 449 suburban school districts with at least a thousand black students; Fulton County had the fifth-highest. That year, 70 percent of Fulton County's African American students and 74 percent of DeKalb County's African American students would have had to switch schools in order for all schools in those districts to reflect the racial make-up of each district as a whole.75Fry, The Rapid Growth and Changing Complexion of Suburban Public Schools.
Both of these trends—more African American students attending majority-minority schools and increasing segregation within districts—are worrisome. While research on achievement gaps has highlighted a range of factors that may contribute to disparities between white and black students' proficiency (factors including students' socioeconomic status, school quality, and teacher experience), segregated schools have "a negative influence on academic achievement and/or [contribute] to black/white achievement gaps."76Dennis J. Condron, Daniel Tope, Christina R. Steidl, and Kendralin J. Freeman, "Racial Segregation and the Black/White Achievement Gap, 1992 to 2009," Sociological Quarterly 54 (2013): 130–157; David Card and Jesse Rothstein, "Racial Segregation and the Black–White Test Score Gap," Journal of Public Economics 91, no. 11 (2007): 2158–2184; Christy Lleras, "Race, Racial Concentration, and the Dynamics of Educational Inequality Across Urban and Suburban Schools," American Educational Research Journal 45, no. 4 (2008): 886–912; Sean F. Reardon, Joseph P. Robinson-Cimpian, and Ericka S. Weathers, "Patterns and Trends in Racial/Ethnic and Socioeconomic Academic Achievement Gaps," Handbook of Research in Education Finance and Policy (2008): 497–516; Jacob Vigdor and Jens Ludwig, "Segregation and the Black–White Test Score Gap," Working Paper 12988 (Cambridge, MA, National Bureau of Economic Research, 2007), http://www.nber.org/papers/w12988; Siegel-Hawley, "City Lines, County Lines, Color Lines."
Segregation in neighborhoods and schools intensifies "group stratification by creating resource-rich educational environments for white students and resource-poor educational environments for black students."77Condron, Tope, Steidl, and Freeman, "Racial Segregation and the Black/White Achievement Gap." Black students are more likely to have teachers with fewer years of teaching experience and attend schools with higher student turnover rates and higher poverty rates.78Eric A. Hanushek and Steven G. Rivkin, School Quality and the Black–White Achievement Gap, Working Paper 12651 (Cambridge: National Bureau of Economic Research, 2006), http://www.nber.org/papers/w12651.pdf; Richard J. Murnane, John B. Willett, Kristen L. Bub, Kathleen McCartney, "Understanding Trends in the Black-White Achievement Gaps During the First Years of School," Brookings-Wharton Papers on Urban Affairs (2006): 97–135. Resource-poor schools, where minority students and lower income students are concentrated, are less able to help students achieve and succeed.79Raj Chetty, Nathaniel Hendren, Patrick Kline, and Emmanuel Saez, "The Equality of Opportunity Project," http://www.equality-of-opportunity.org/; Hanushek and Rivkin, School Quality and the Black–White Achievement Gap.
Resource disparities between different neighborhoods and public schools are especially apparent in Atlanta, considered "one of America's most affluent metropolitan areas yet also one of the most physically divided by income" and race.80David Leonhardt, "Geography Seen as Barrier To Climbing Class Ladder," New York Times, July 22, 2013, A1, http://www.nytimes.com/images/2013/07/22/nytfrontpage/scan.pdf. Metro Atlanta is proving to be particularly inhospitable to lower-income households' upward mobility. Among the nation's fifty-five largest commuting zones (similar to metropolitan areas), Atlanta ranked fifty-second in terms of the odds that its children born into low-income families between 1980 and 1982 would reach the top income quintile as adults; these children's odds stood at just 4 percent in Atlanta.81Raj Chetty, Nathaniel Hendren, Patrick Kline, and Emmanuel Saez, Online Data Tables, "The Equality of Opportunity Project," http://www.equality-of-opportunity.org/data/. Within the MSA, low-income children's chances of reaching higher incomes as adults were worse in more diverse counties than in predominantly white ones.82Ibid.
Conclusion
The Atlanta region provides an important and instructive study of recent national trends. The migration of black Americans back to regions of the South, the suburbanization of blacks and the exurbanizing of whites, the persistent residential segregation, and the increasing segregation in schools, have all played out with particular force in Atlanta. Metro Atlanta's segregated neighborhoods and schools, which now extend well into suburbia, are not only underserving the current generation of minority homeowners and students, but stand to undercut the life chances of future generations of minority residents as well. As it booms and continues to sprawl, metro Atlanta shows how segregation puts limits on minority homeowners' ability to build wealth, minority students' ability to excel in school, and low-income families' ability to achieve upward mobility.83Condron, Tope, Steidl, and Freeman, "Racial Segregation and the Black/White Achievement Gap." 
About the Author
Karen Beck Pooley is a senior associate at czb LLC, a neighborhood planning firm, and teaches in the Department of Political Science and the South Side Initiative at Lehigh University in Bethlehem, Pennsylvania. Pooley received a PhD from the University of Pennsylvania's Department of City and Regional Planning in 2007. Her research focuses on neighborhood revitalization strategies, techniques for measuring housing market conditions, and the evolution of federal, state, and local housing policy.
Recommended Resources
Text
Bilefsky, Dan. "For New Life, Blacks in City Head to South." New York Times, June 22, 2011. A1. http://www.nytimes.com/2011/06/22/nyregion/many-black-new-yorkers-are-moving-to-the-south.html.
Card, David, and Jesse Rothstein. "Racial Segregation and the Black–White Test Score Gap." Journal of Public Economics 91, no. 11 (2007): 2158–2184.
Cashin, Sheryll. The Failures Of Integration: How Race and Class are Undermining the American Dream. New York City: Public Affairs, 2004.
Clayton, Obie, Cynthia Hewitt, and Gregory Hall. "Atlanta and 'The Dream': Race, Ethnicity, and Recent Demographic and Socioeconomic Trends." In Past Trends and Future Prospects of the American City: The Dynamics of Atlanta, edited by David L. Sjoquist, 219–248. Lanham: Lexington Books, 2009.
Condron, Dennis J., Daniel Tope, Christina R. Steidl, and Kendralin J. Freeman. "Racial Segregation and the Black/White Achievement Gap, 1992 to 2009." Sociological Quarterly 54 (2013): 130–157.
Dawkins, Casey J. "Recent Evidence on the Continuing Causes of Black-White Residential Segregation." Journal of Urban Affairs 26, no. 3 (2004): 379–400.
Freeman, Eric. "The Shifting Geography of Urban Education." Education and Urban Society 42, no. 6 (2010): 674–704.
Ingwerson, Marshall. "Atlanta Becomes Mecca for Black Middle Class in America." The Christian Science Monitor, 1987. http://www.csmonitor.com/1987/0529/amecca.html.
Kromm, Chris. "Black Belt Power: African Americans Come Back South, Change Political Landscape." Race, Poverty & the Environment 18, no. 2 (2011): 17. http://www.southernstudies.org/2011/09/black-power-african-americans-come-back-south-shake-up-southern-politics.html.
Leonhardt, David. "Geography Seen as Barrier To Climbing Class Ladder." New York Times, July 22, 2013. A1. http://www.nytimes.com/2013/07/22/business/in-climbing-income-ladder-location-matters.html.
Lleras, Christy. "Race, Racial Concentration, and the Dynamics of Educational Inequality Across Urban and Suburban Schools." American Educational Research Journal 45, no. 4 (2008): 886–912.
Lloyd, Richard. "Urbanization and the Southern United States." Annual Review of Sociology 38 (2012): 483–506.
Massey, Douglas S., and Nancy A. Denton. American Apartheid: Segregation and the Making of the Underclass. Cambridge, MA: Harvard University Press, 1993.
Murnane, Richard J., John B. Willett, Kristen L. Bub, Kathleen McCartney. "Understanding Trends in the Black-White Achievement Gaps during the First Years of School." Brookings-Wharton Papers on Urban Affairs (2006): 97–135.
Reardon, Sean F., Joseph P. Robinson-Cimpian, and Ericka S. Weathers. "Patterns and Trends in Racial/Ethnic and Socioeconomic Academic Achievement Gaps." In Handbook of Research in Education Finance and Policy, edited by Helen F. Ladd and Margaret Goertz, 497–516. London: Routledge, 2008.
Reardon, Sean F. and John T. Yun. "Suburban Racial Change and Suburban School Segregation, 1987–95." Sociology of Education 74, no. 2 (2001): 79–101.
Reardon, Sean F., John T. Yun, and Tamela McNulty Eitle. "The Changing Structure of School Segregation: Measurement and Evidence of Multiracial Metropolitan-Area School Segregation, 1989–1995." Demography 37, no. 3 (2000): 351–364.
Reeve, Elspeth. "South Now More Integrated, More Racially Diverse." The Wire: News from the Atlantic, 2011. http://www.thewire.com/national/2011/03/statistical-proof-south-finally-more-integrated/36096/.
Rugh, Jacob S., and Douglas S. Massey. "Racial Segregation and the American Foreclosure Crisis." American Sociological Review 75, no. 5 (2010): 629–651.
Severson, Kim. "Stars Flock to Atlanta, Reshaping a Center of Black Culture." New York Times, November 26, 2011. A11. http://www.nytimes.com/2011/11/26/us/atlanta-emerges-as-a-center-of-black-entertainment.html.
Siegel-Hawley, Genevieve. "City Lines, County Lines, Color Lines: The Relationship between School and Housing Segregation in Four Southern Metro Areas." Teachers College Record 115, no. 6 (2013): 1–45. http://www.tcrecord.org/Content.asp?ContentID=16988.
Sjoquist, David L. "The Atlanta Paradox: Introduction." In The Atlanta Paradox, edited by David L. Sjoquist, 1–14. New York City: Russell Sage Foundation, 2000.
Sugrue, Thomas J. The Origins of the Urban Crisis: Race and Inequality in Postwar Detroit. Princeton, NJ: Princeton University Press, 1996.
Sullivan, John. "African Americans Moving South—and to the Suburbs." Race, Poverty & the Environment 18, no. 2 (2011): 16–19. http://reimaginerpe.org/18-2/sullivan.
Tavernise, Sabrina, and Robert Gebeloff. "Many U.S. Blacks Moving to South, Reversing Trend." New York Times, March 25, 2011. A1. http://www.nytimes.com/2011/03/25/us/25south.html.
Wilkerson, Isabel. The Warmth of Other Suns: The Epic Story of America's Great Migration. New York: Random House, 2010.
Yen, Hope. "In a Reversal, More Blacks Moving Back to South: Culture, Good Jobs, Relatives Spur Return." Washington Times. February 16, 2011. http://www.washingtontimes.com/news/2011/feb/16/in-a-reversal-more-blacks-moving-back-to-south/.
Reports
State of Metropolitan America. Washington, DC: Brookings Institution, 2010. http://www.brookings.edu/about/programs/metro/stateofmetroamerica.
Unequal Burden: Income & Racial Disparities in Subprime Lending in America. Washington, DC: US Department of Housing and Urban Development, 2000. http://www.huduser.org/portal/publications/fairhsg/unequal.html.
Austin, Algernon. Reversal of Fortune: Economic Gains of 1990s Overturned for African Americans from 2000–07. Washington, DC: Economic Policy Institute, 2008. http://www.epi.org/publication/bp220/.
Bocian, Debbie Gruenstein, Wei Li, and Keith S. Ernst. Foreclosures by Race and Ethnicity: The Demographics of a Crisis. Durham, NC: Center for Responsible Lending, 2010. http://www.responsiblelending.org/research-publication/foreclosures-race-and-ethnicity.
Chetty, Raj, Nathaniel Hendren, Patrick Kline, and Emmanuel Saez. The Equality of Opportunity Project. 2013. http://www.equality-of-opportunity.org/.
Clotfelter, Charles T. Are Whites Still "Fleeing"? Racial Patterns and Enrollment Shifts in Urban Public Schools, 1987–1996. Working Paper 7290. Cambridge, MA: National Bureau of Economic Research, 1999. http://www.nber.org/papers/w7290.
Frey, William H. The New Great Migration: Black Americans' Return to the South, 1965–2000. Washington, DC: Brookings Institution, 2004. http://www.brookings.edu/research/reports/2004/05/demographics-frey.
———. Diversity Spreads Out: Metropolitan Shifts in Hispanic, Asian, and Black Populations Since 2000. Washington, DC: Brookings Institution, 2006. http://www.brookings.edu/research/reports/2006/03/demographics-frey.
———. "The 2010 Census: How Is America Changing?" Urban Land. Urban Land Institute, 2011. http://www.frey-demographer.org/briefs/B-2010-3_ULJF11_p34_36.pdf.
———. Melting Pot Cities and Suburbs: Racial and Ethnic Change in Metro America in the 2000s. Washington, DC: Brookings Institution, 2011. http://www.brookings.edu/research/papers/2011/05/04-census-ethnicity-frey.
Fry, Richard. The Rapid Growth and Changing Complexion of Suburban Public Schools. Washington, DC: Pew Hispanic Center, 2009. http://www.pewhispanic.org/files/reports/105.pdf.
Hanushek, Eric A., and Steven G. Rivkin. School Quality and the Black–White Achievement Gap. Working Paper 12651. National Bureau of Economic Research, 2006. http://www.nber.org/papers/w12651.pdf.
Hobbs, Frank, and Nicole Stoops. Census 2000 Special Reports: Demographic Trends of the 20th Century. Washington, DC: US Census Bureau, 2002. https://www.census.gov/prod/2002pubs/censr-4.pdf.
Kochhar, Rakesh, Ana Gonzalez-Barrera, and Daniel Dockterman. Through Boom and Bust: Minorities, Immigrants and Homeownership. Washington, DC: Pew Hispanic Center, 2009. http://www.pewhispanic.org/files/reports/109.pdf.
Leung, Rebecca. "Going Home To The South." CBS News, 2003. http://www.cbsnews.com/8301-18560_162-558375.html.
Logan, John R., and Brian Stults. "The Persistence of Segregation in the Metropolis: New Findings from the 2010 Census." American Communities Project: Russell Sage Foundation, 2011. http://www.s4.brown.edu/us2010/Data/Report/report2.pdf.
Rusk, David. The "Segregation Tax": The Cost of Racial Segregation to Black Homeowners. Washington, DC: Brookings Institution, 2001. http://www.brookings.edu/research/reports/2001/10/metropolitanpolicy-rusk.
Vigdor, Jacob, and Jens Ludwig. Segregation and the Black–White Test Score Gap. Working Paper 12988. National Bureau of Economic Research, 2007. http://www.nber.org/papers/w12988.
Wiggins, Ovetta, Carol Morello, and Dan Keating. "Prince George's County: Growing, and Growing More Segregated, Census Shows." Washington Post, October 30, 2011. http://www.washingtonpost.com/local/prince-georges-county-growing-and-growing-more-segregated-census-shows/2011/10/14/gIQAbCc1TM_story.html.
Wilson, Steven G., David A. Plane, Paul J. Mackun, Thomas R. Fischetti, and Justyna Goworowska. Patterns of Metropolitan and Micropolitan Population Change: 2000 to 2010 (2010 Census Special Reports). Washington, DC: US Department of Commerce, Economics and Statistics Administration, and US Census Bureau, 2012. http://www.census.gov/library/publications/2012/dec/c2010sr-01.html.
Similar Publications


| 1. | Obie Clayton, Cynthia Hewitt, and Gregory Hall, "Atlanta and 'The Dream': Race, Ethnicity, and Recent Demographic and Socioeconomic Trends," Past Trends and Future Prospects of the American City: The Dynamics of Atlanta, ed. David L. Sjoquist (Lanham: Lexington Books, 2009), 219–248. |
|---|---|
| 2. | Richard Lloyd, "Urbanization and the Southern United States," Annual Review of Sociology 38 (2012): 483–506. |
| 3. | Officially the Atlanta-Sandy Springs-Roswell, GA Metropolitan Statistical Area, the "metro Atlanta" region includes the following twenty-eight counties: Barrow, Bartow, Butts, Carroll, Cherokee, Clayton, Cobb, Coweta, Dawson, DeKalb, Douglas, Fayette, Forsyth, Fulton, Gwinnett, Haralson, Heard, Henry, Jasper, Lamar, Meriwether, Newton, Paulding, Pickens, Pike, Rockdale, Spalding, and Walton. |
| 4. | See Census Regions and Divisons of the United States for the states included in each Census region, http://www2.census.gov/geo/pdfs/maps-data/maps/reference/us_regdiv.pdf. As used throughout this essay, "region" refers to the Atlanta metropolitan region or Atlanta MSA. |
| 5. | Between 1970 and 2010, for example, as the Northeast's population grew by 13 percent and the Midwest's by 18 percent, the South's nearly doubled (increasing 82 percent) and the West's more than doubled (increasing 107 percent) (Table 16. Population: 1790 to 1990, retrieved from https://www.census.gov/population/www/censusdata/files/table-16.pdf; Table P1 Total Population from both the Census 2000 Summary File 1 (SF 1) 100-Percent Data and the 2010 Census Summary File 1, retrieved from American FactFinder, http://factfinder.census.gov). |
| 6. | The "New Great Migration" title stems from the fact that the pattern represents a reversal of what is known as the Great Migration, or the mass movement of African Americans out of the South primarily to northern, midwestern, and California cities, from roughly 1910 to 1970. |
| 7. | John R. Logan and Brian Stults, The Persistence of Segregation in the Metropolis: New Findings from the 2010 Census (Washington DC: American Communities Project, Russell Sage Foundation, 2011), http://www.s4.brown.edu/us2010/Data/Report/report2.pdf. Census brief prepared for Project US2010. |
| 8. | Raj Chetty, Nathaniel Hendren, Patrick Kline, and Emmanuel Saez, "The Equality of Opportunity Project," http://www.equality-of-opportunity.org/; John D. Barge, PK-12 Student Enrollment by Race/Ethnicity and Gender (Georgia Department of Education, Full Time Equivalent Data Collection System, 2000 and 2013). |
| 9. | Chetty, Hendren, Kline, and Saez, "The Equality of Opportunity Project." |
| 10. | The Census-defined "South" includes Alabama, Arkansas, Delaware, District of Columbia, Florida, Georgia, Kentucky, Louisiana, Maryland, Mississippi, North Carolina, Oklahoma, South Carolina, Tennessee, Texas, Virginia and West Virginia. |
| 11. | Table 16. Population: 1790 to 1990, retrieved from www.census.gov/population/www/censusdata/files/table-16.pdf; Table P1 Total Population from both the Census 2000 Summary File 1 (SF 1), 100-Percent Data and the 2010 Census Summary File 1, retrieved from factfinder.census.gov. |
| 12. | "State of Metropolitan America," Brookings Institution, http://www.brookings.edu/about/programs/metro/stateofmetroamerica; US Department of Congress, Economics and Statistics Administration, Bureau of the Census, "1990 Census of Population and Housing Unit Counts" (1993), https://www.census.gov/prod/cen1990/cph2/cph-2-1-1.pdf. |
| 13. | Frank Hobbs and Nicole Stoops, Census 2000 Special Reports: Demographic Trends of the 20th Century (Washington, DC: US Census Bureau, 2002), https://www.census.gov/prod/2002pubs/censr-4.pdf. |
| 14. | William H. Frey, Diversity Spreads Out: Metropolitan Shifts in Hispanic, Asian, and Black Populations Since 2000 (Washington, DC: Brookings Institution, 2006), http://www.brookings.edu/research/reports/2006/03/demographics-frey. |
| 15. | Dan Bilefsky, "For New Life, Blacks in City Head to South," New York Times, June 22, 2011, A1, http://www.nytimes.com/2011/06/22/nyregion/many-black-new-yorkers-are-moving-to-the-south.html; William H. Frey, The New Great Migration: Black Americans' Return to the South, 1965–2000 (Washington, DC: Brookings Institution, 2004), http://www.brookings.edu/research/reports/2004/05/demographics-frey; Elspeth Reeve, "South Now More Integrated, More Racially Diverse," The Wire: News from the Atlantic, March 2011, http://www.thewire.com/national/2011/03/statistical-proof-south-finally-more-integrated/36096/. |
| 16. | The Great Migration refers to the movement of roughly six million African Americans out of the South between the years of the First World War to the 1970s. See Isabel Wilkerson, The Warmth of Other Suns: The Epic Story of America's Great Migration (New York: Random House, 2010), 8–9. Movers sought to escape the "oppressive racial climate in the South"—the segregation, discriminatory practices, and overt racism that typified the Jim Crow era. In addition to the "promise of freedom" outside the South was the wealth of opportunity in the industrial cities of the Northeast and Midwest. The millions of manufacturing jobs available to unskilled workers in these locations stood in stark contrast to the quickly evaporating pool of agricultural jobs in the rural South, which were disappearing due to the "mechanization of southern agriculture," which entirely recast what had been a very labor-intensive system. See Frey, The New Great Migration, 2; Bilefsky, "For New Life, Blacks in City Head South"; Hope Yen, "In a Reversal, More Blacks Moving Back to South: Culture, Good Jobs, Relatives Spur Return," Washington Times, February 16, 2011, http://www.washingtontimes.com/news/2011/feb/16/in-a-reversal-more-blacks-moving-back-to-south/; Thomas J. Sugrue,The Origins of the Urban Crisis: Race and Inequality in Postwar Detroit, (Princeton, NJ: Princeton University Press, 1996), 7. |
| 17. | William H. Frey, "The 2010 Census: How Is America Changing?" Urban Land (2011), http://www.frey-demographer.org/briefs/B-2010-3_ULJF11_p34_36.pdf; Hobbs and Stoops, Demographic Trends of the 20th Century; Sabrina Tavernise and Robert Gebeloff, "Many U.S. Blacks Moving to South, Reversing Trend," New York Times, March 25, 2011, A1, http://www.nytimes.com/2011/03/25/us/25south.html; Yen, "In a Reversal, More Blacks Moving Back to South." |
| 18. | Tavernise and Gebeloff, "Many U.S. Blacks Moving to South, Reversing Trend." |
| 19. | Sugrue, The Origins of the Urban Crisis; Rebecca Leung, "Going Home To The South," CBS News, June 12, 2003, http://www.cbsnews.com/8301-18560_162-558375.html. |
| 20. | Yen, "In a Reversal, More Blacks Moving Back to South." |
| 21. | Bilefsky, "For New Life, Blacks in City Head to South." |
| 22. | Ibid; Leung, "Going Home To The South"; Tavernise and Gebeloff, "Many U.S. Blacks Moving to South, Reversing Trend." |
| 23. | Frey, The New Great Migration. |
| 24. | Chris Kromm, "Black Belt Power: African Americans Come Back South, Change Political Landscape," Race, Poverty & the Environment 18, no. 2 (2011): 17, http://www.southernstudies.org/2011/09/black-power-african-americans-come-back-south-shake-up-southern-politics.html. |
| 25. | William H. Frey, Diversity Spreads Out: Metropolitan Shifts in Hispanic, Asian, and Black Populations Since 2000 (Washington, DC: Brookings Institution, 2006), http://www.brookings.edu/research/reports/2006/03/demographics-frey. |
| 26. | Frey, "The 2010 Census"; Brookings Institution, "State of Metropolitan America." |
| 27. | Steven G. Wilson, David A. Plane, Paul J. Mackun, Thomas R. Fischetti, and Justyna Goworowska. Patterns of Metropolitan and Micropolitan Population Change: 2000 to 2010 (2010 Census Special Reports), SUS Census Bureau, C2010SR-01 (Washington, DC: US Department of Commerce, Economics and Statistics Administration, and US Census Bureau, 2012), http://www.census.gov/library/publications/2012/dec/c2010sr-01.html. |
| 28. | Marshall Ingwerson, "Atlanta Becomes Mecca for Black Middle Class in America," The Christian Science Monitor, May 29, 1987, http://www.csmonitor.com/1987/0529/amecca.html; David L. Sjoquist, "The Atlanta Paradox: Introduction," in The Atlanta Paradox, ed. David L. Sjoquist (New York City: Russell Sage Foundation, 2000), 1–14. |
| 29. | Ingwerson, "Atlanta Becomes Mecca for Black Middle Class in America." |
| 30. | American Community Survey, Table B19001B, "Household Income in the Past 12 Months," 2007–2011 American Community Survey 5-Year Estimates, https://www.census.gov/newsroom/releases/archives/news_conferences/20121203_acs5yr.html. |
| 31. | American Community Survey, Table P151B, "Household Income in 1999," Census 2000 Summary File 3 (SF 3). |
| 32. | William H. Frey, Melting Pot Cities and Suburbs: Racial and Ethnic Change in Metro America in the 2000s (Washington, DC: Brookings Institution, 2011), http://www.brookings.edu/research/papers/2011/05/04-census-ethnicity-frey. |
| 33. | This analysis relied on the Brookings Institution's labeling of tracts as either urban or suburban, which considers urban census tracts to be those within either the primary city listed in the official MSA name or in other cities listed in the MSA names that have populations of at least 100,000. Suburban census tracts are those whose center point falls within the MSA boundary but outside the MSA's city or cities. In the Atlanta MSA, only tracts within the city of Atlanta are considered urban; all tracts outside of the city in DeKalb and Fulton Counties, as well as all tracts in Barrow, Bartow, Butts, Carroll, Cherokee, Clayton, Cobb, Coweta, Dawson, Douglas, Fayette, Forsyth, Gwinnett, Haralson, Heard, Henry, Jasper, Lamar, Meriwether, Newton, Paulding, Pickens, Pike, Rockdale, Spalding, and Walton Counties, are considered suburban. |
| 34. | John Sullivan, "African Americans Moving South—and to the Suburbs," Race, Poverty & the Environment 18, no. 2 (2011): 16–19, http://reimaginerpe.org/18-2/sullivan. |
| 35. | Frey, Melting Pot Cities and Suburbs. |
| 36. | These eleven include the suburban portions of DeKalb and Fulton counties, which also include sections of the city of Atlanta. |
| 37. | At the time of publication, Cobb was included with other counties listed as "nearing majority black" because it was statistically more like those counties than those classified as "diversifying." However, at 24% black, Cobb County was on the border and could have been included as either "nearing majority black" or "diversifying." |
| 38. | Eric Freeman, "The Shifting Geography of Urban Education," Education and Urban Society 42, no. 6 (2010): 674–704. |
| 39. | Tavernise and Gebeloff, "Many U.S. Blacks Moving to South, Reversing Trend." |
| 40. | Casey J. Dawkins, "Recent Evidence on the Continuing Causes of Black-White Residential Segregation,"Journal of Urban Affairs 26, no. 3 (2004): 379–400. |
| 41. | Barrow, Bartow, Carroll, Cherokee, Coweta, Forsyth, and Walton counties collectively gained over 175,000 non-Hispanic white residents between 2000 and 2010; over the same time period, the number of non-Hispanic blacks in these counties rose by less than 35,000. |
| 42. | Douglas S. Massey and Nancy A. Denton, American Apartheid: Segregation and the Making of the Underclass (Cambridge: Harvard University Press, 1993). |
| 43. | The Index of Dissimilarity, a popular summary statistic for quantifying an area's level of segregation, measures how evenly the populations of two racial or ethnic groups are distributed across a particular geographic area and describes the percentage of group members who would have to move in order for their racial or ethnic group to be evenly distributed (so that each Census tract's racial breakdown would match the MSA's overall racial breakdown). |
| 44. | A value of 60 or more is considered high. |
| 45. | Logan and Stults, The Persistence of Segregation in the Metropolis. |
| 46. | This study considers Census tracts with at least 20 percent non-Hispanic white residents and at least 20 percent non-Hispanic black residents to be "integrated." See Sheryll Cashin, The Failures Of Integration: How Race and Class are Undermining the American Dream (New York City: Public Affairs, 2004), 42. Census tracts in which more than 85 percent were of one race or ethnicity were classified as "segregated." See Ovetta Wiggins, Carol Morello, and Dan Keating, "Prince George's County: Growing, and Growing More Segregated, Census Shows," Washington Post, October 30, 2011, http://www.washingtonpost.com/local/prince-georges-county-growing-and-growing-more-segregated-census-shows/2011/10/14/gIQAbCc1TM_story.html. If tracts did not qualify "integrated" or "segregated," they were labeled "majority white," "majority black," or "majority Hispanic," if percentages of a particular race or ethnicity exceeded 50 percent. In 2010, 10 tracts had less than 15 percent white but no majority of either blacks or Hispanics (these were classified as "majority black/Hispanic"), and 12 tracts had more 15 percent white but no majority of any race or ethnicity (these were classified as "integrated"). |
| 47. | "Majority-minority" tracts include "majority black," "majority "Hispanic," and "majority black/Hispanic" tracts; "Segregated-minority" tracts include "segregated black" and "segregated Hispanic" tracts. |
| 48. | Dawkins, "Recent Evidence on the Continuing Causes of Black-White Residential Segregation"; Genevieve Siegel-Hawley, "City Lines, County Lines, Color Lines: The Relationship between School and Housing Segregation in Four Southern Metro Areas," Teachers College Record 115, no. 6 (2013): 1–45. http://www.tcrecord.org/Content.asp?ContentID=16988. |
| 49. | Massey and Denton, American Apartheid. |
| 50. | Dawkins, "Recent Evidence on the Continuing Causes of Black-White Residential Segregation." |
| 51. | David Rusk, The "Segregation Tax": The Cost of Racial Segregation to Black Homeowners (Washington, DC: Brookings Institution, 2001), http://www.brookings.edu/research/reports/2001/10/metropolitanpolicy-rusk. |
| 52. | Ibid. |
| 53. | Ibid. |
| 54. | Ibid. |
| 55. | Algernon Austin, Reversal of Fortune: Economic Gains of 1990s Overturned for African Americans from 2000–07 (Washington, DC: Economic Policy Institute, 2008), http://www.epi.org/publication/bp220/. |
| 56. | Ibid; Rakesh Kochhar, Ana Gonzalez-Barrera, and Daniel Dockterman, Through Boom and Bust: Minorities, Immigrants and Homeownership (Washington, DC: Pew Hispanic Center, 2009), http://www.pewhispanic.org/files/reports/109.pdf. |
| 57. | Higher-priced loans are defined as those with annual percentage rates that exceed the rate of US Treasury securities of comparable maturity by 3 percentage points. The chart reflects trends among conventional, first-lien loans borrowed for the purchase of 1- to 4-family properties for owner occupancy. |
| 58. | Austin, Reversal of Fortune; Kochhar, Gonzalez-Barrera, and Dockterman, Through Boom and Bust. |
| 59. | Jacob S. Rugh and Douglas S. Massey, "Racial Segregation and the American Foreclosure Crisis." American Sociological Review 75, no. 5 (2010): 629–651. |
| 60. | Ibid. |
| 61. | Debbie Gruenstein Bocian, Wei Li, and Keith S. Ernst, Foreclosures by Race and Ethnicity: The Demographics of a Crisis (Durham, NC: Center for Responsible Lending, 2010), http://www.responsiblelending.org/research-publication/foreclosures-race-and-ethnicity. |
| 62. | Kochhar, Gonzalez-Barrera, and Dockterman, Through Boom and Bust. |
| 63. | Jacob S. Rugh and Douglas S. Massey, "Racial Segregation and the American Foreclosure Crisis," American Sociological Review 75, no. 5 (2010): 629–651. |
| 64. | US Department of Housing and Urban Development, Unequal Burden: Income & Racial Disparities in Subprime Lending in America, (Washington, DC: US Department of Housing and Urban Development, 2000), http://www.huduser.org/portal/publications/fairhsg/unequal.html. |
| 65. | Kochhar, Gonzalez-Barrera, and Dockterman, Through Boom and Bust. |
| 66. | Ibid. |
| 67. | Ibid. |
| 68. | Rugh and Massey, "Racial Segregation and the American Foreclosure Crisis." |
| 69. | Austin, Reversal of Fortune. |
| 70. | Richard Fry, The Rapid Growth and Changing Complexion of Suburban Public Schools (Washington, DC: Pew Hispanic Center, 2009), http://www.pewhispanic.org/files/reports/105.pdf. |
| 71. | Sean F. Reardon, John T. Yun, and Tamela McNulty Eitle, "The Changing Structure of School Segregation: Measurement and Evidence of Multiracial Metropolitan-Area School Segregation, 1989–1995," Demography 37, no. 3 (2000): 351–364. |
| 72. | Charles T. Clotfelter, Are Whites Still "Fleeing"? Racial Patterns and Enrollment Shifts in Urban Public Schools, 1987–1996, Working Paper 7290 (Cambridge: National Bureau of Economic Research, 1999), http://www.nber.org/papers/w7290; Freeman, "The Shifting Geography of Urban Education." |
| 73. | Reardon, Yun, and Eitle, "The Changing Structure of School Segregation." |
| 74. | Majority-minority here refers to any school in which at least half of all students are not non-Hispanic white. For consistency sake, "integrated" schools are identified using the same criteria as those used to identify "integrated" Census tracts earlier in this essay. |
| 75. | Fry, The Rapid Growth and Changing Complexion of Suburban Public Schools. |
| 76. | Dennis J. Condron, Daniel Tope, Christina R. Steidl, and Kendralin J. Freeman, "Racial Segregation and the Black/White Achievement Gap, 1992 to 2009," Sociological Quarterly 54 (2013): 130–157; David Card and Jesse Rothstein, "Racial Segregation and the Black–White Test Score Gap," Journal of Public Economics 91, no. 11 (2007): 2158–2184; Christy Lleras, "Race, Racial Concentration, and the Dynamics of Educational Inequality Across Urban and Suburban Schools," American Educational Research Journal 45, no. 4 (2008): 886–912; Sean F. Reardon, Joseph P. Robinson-Cimpian, and Ericka S. Weathers, "Patterns and Trends in Racial/Ethnic and Socioeconomic Academic Achievement Gaps," Handbook of Research in Education Finance and Policy (2008): 497–516; Jacob Vigdor and Jens Ludwig, "Segregation and the Black–White Test Score Gap," Working Paper 12988 (Cambridge, MA, National Bureau of Economic Research, 2007), http://www.nber.org/papers/w12988; Siegel-Hawley, "City Lines, County Lines, Color Lines." |
| 77. | Condron, Tope, Steidl, and Freeman, "Racial Segregation and the Black/White Achievement Gap." |
| 78. | Eric A. Hanushek and Steven G. Rivkin, School Quality and the Black–White Achievement Gap, Working Paper 12651 (Cambridge: National Bureau of Economic Research, 2006), http://www.nber.org/papers/w12651.pdf; Richard J. Murnane, John B. Willett, Kristen L. Bub, Kathleen McCartney, "Understanding Trends in the Black-White Achievement Gaps During the First Years of School," Brookings-Wharton Papers on Urban Affairs (2006): 97–135. |
| 79. | Raj Chetty, Nathaniel Hendren, Patrick Kline, and Emmanuel Saez, "The Equality of Opportunity Project," http://www.equality-of-opportunity.org/; Hanushek and Rivkin, School Quality and the Black–White Achievement Gap. |
| 80. | David Leonhardt, "Geography Seen as Barrier To Climbing Class Ladder," New York Times, July 22, 2013, A1, http://www.nytimes.com/images/2013/07/22/nytfrontpage/scan.pdf. |
| 81. | Raj Chetty, Nathaniel Hendren, Patrick Kline, and Emmanuel Saez, Online Data Tables, "The Equality of Opportunity Project," http://www.equality-of-opportunity.org/data/. |
| 82. | Ibid. |
| 83. | Condron, Tope, Steidl, and Freeman, "Racial Segregation and the Black/White Achievement Gap." |